
Getting started
CoroPlus® Process Control monitors your tools and analyses machining processes such as lathing, drilling, milling, grinding and dressing. The visualisation of the sensor or process signals sets the prerequisite for optimising the machining processes.
With the CoroPlus® Process Control operating and visualisation software, PROVIS 3, you can operate the monitoring system.
Working with PROVIS 3
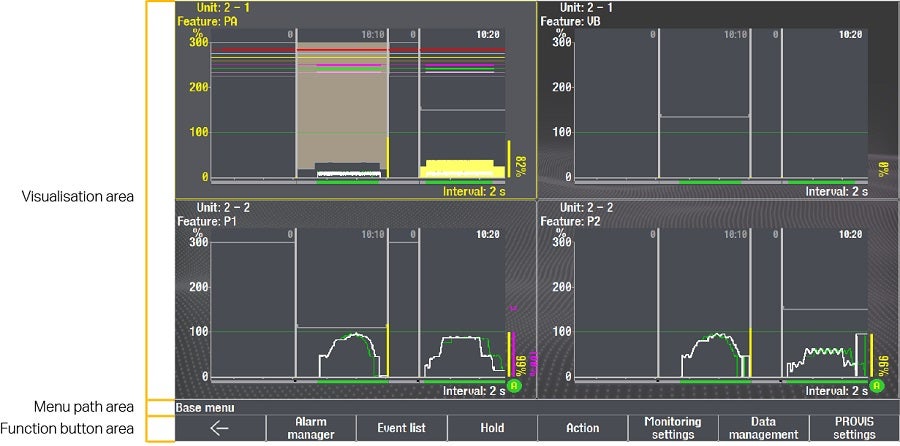
PROVIS 3 home screen is divided into three areas:
- Visualisation area
- Menu path area
- Function button area
The visualisation area at the top displays the features and limits of the respective station(s). Display and selection fields for unit settings, the operating states of the monitoring system (Teach-In, Rework, Setup), alarms, etc., are also displayed here.
The function button area is at the bottom. Depending on the context, the layout may change within a screen.
The current menu's name and its path are always displayed above the function buttons in the menu path area.
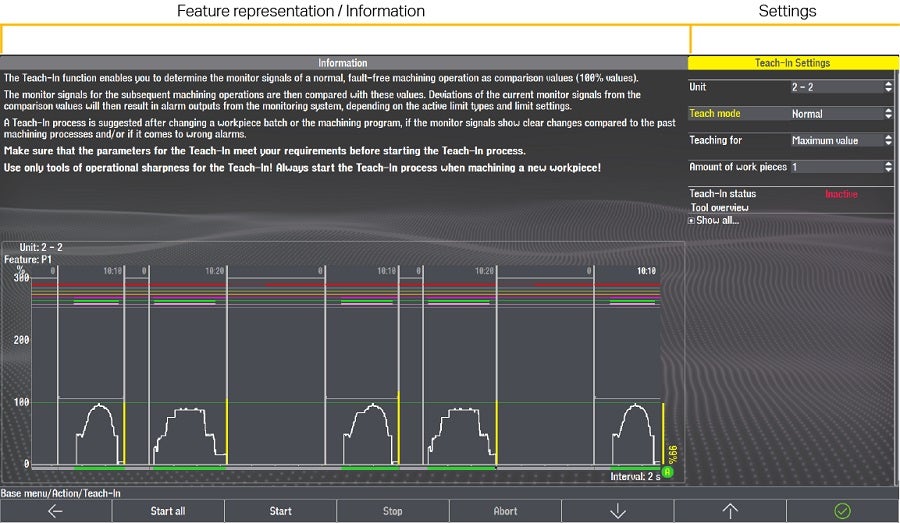
In most menus, the visualisation area is divided into two sections:
- Feature representation is located on the left, along with explanatory text in many menus
- Respective setting options and/or information text are on the right
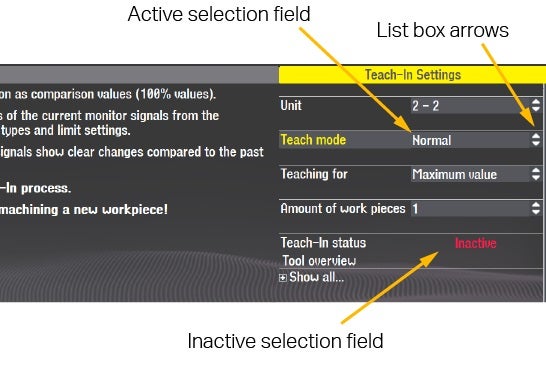
You can change the settings for the monitoring system in the selection fields of PROVIS 3.
A field with a highlighted background is currently active, which means that you can adjust this setting.
A field that does not have a background is inactive. They indicate that it is not possible to change this setting.
How do I select a different display?
The Home screen can display several features. The active feature is displayed with a thin yellow frame and yellow text. You can use the cursor buttons on the control system to switch to another feature.
How do I change to a different entry field?
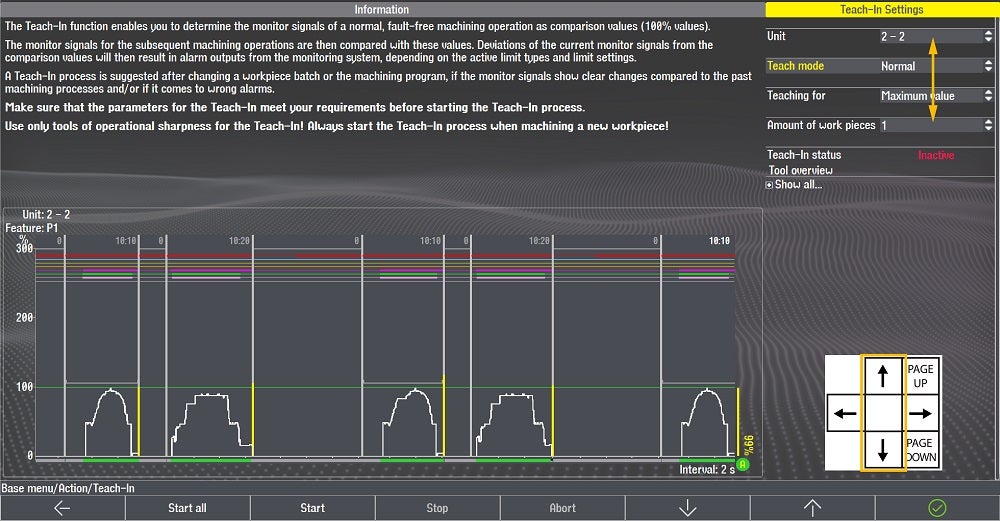
You can use the control system's up and down cursor buttons to change to other entry fields.
How do I make entries?
The function buttons are shown for selected and active entry fields. You can recognize the selected field by the yellow descriptive text.
Use these function buttons to change the value in this selected entry field. The display switches to the next possible value by pressing the function buttons.
Furthermore, you can set configurable number values directly using number keys.
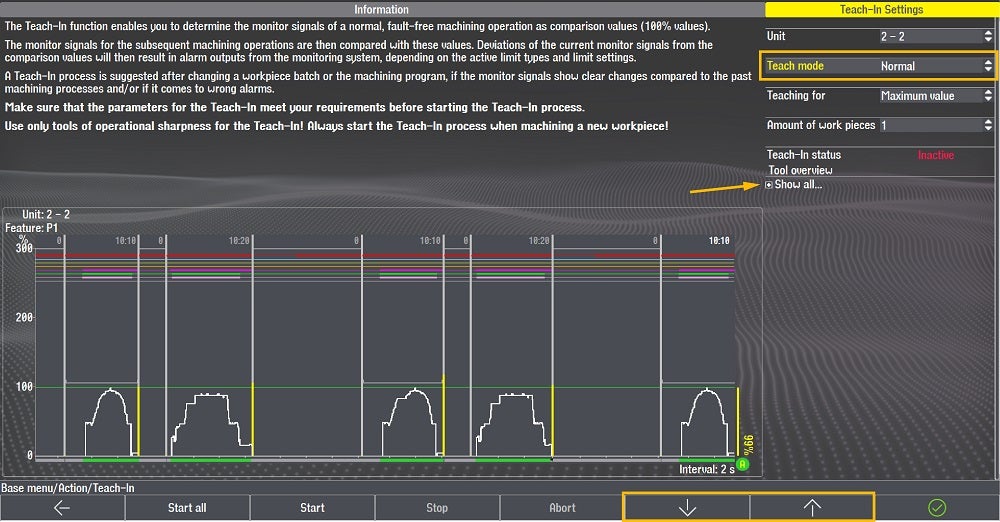
Less frequently used entry fields are hidden under a collective header. Below the header, the text "Details" or "Show all" is displayed next to a plus sign [+]. In this case, the function button [+] is displayed in the function button area.
Pressing this function button opens the hidden entry fields. You can select the displayed entry fields and change the values like all other entry fields. If the function button [-] is shown and pressed, this menu can be closed again.
How do I find an entry in a selection field quickly?
You can display a list of entries in the selection field using quick selection.
- Select the desired setting with the mouse or cursor buttons.
- Press the right cursor button.
- Start entering characters until the desired setting appears.
- Select the desired setting.
- Confirm it with Enter or Input.
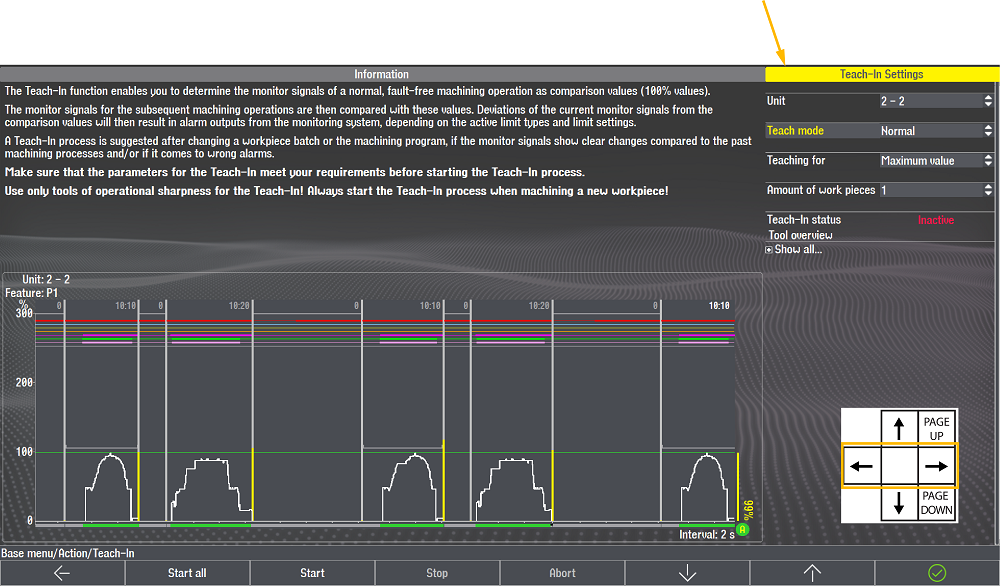
How do I change from the left to the right side of the visualisation area and vice versa?
You can use the right and left cursor buttons on the control system to do so intuitively. The area you are currently in is displayed in yellow.
How do I scroll through longer explanatory text?
Use the control system's buttons Page Up and Page Down to scroll through long texts.
Displays in the visualisation
After switching on the monitor and establishing communication with the connected units, you see the base menu on the monitor of PROVIS 3.
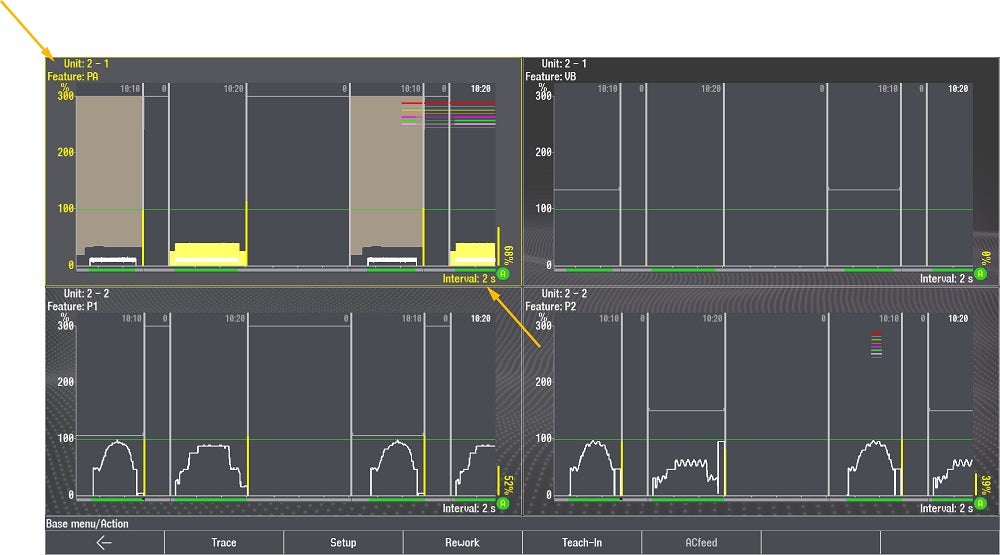
In the visualisation area, the monitor displays the following:
If applicable, several feature representations are displayed. A yellow arrow appears if not all features fit within the visualisation. This arrow at the edge of the visualisation area indicates that you can called up more in this direction. You can switch to these feature representations with the arrow keys of the control system. A feature representation is usually selected (highlighted in white).
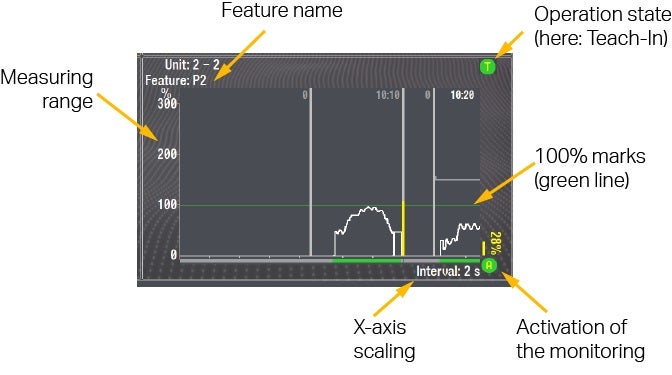
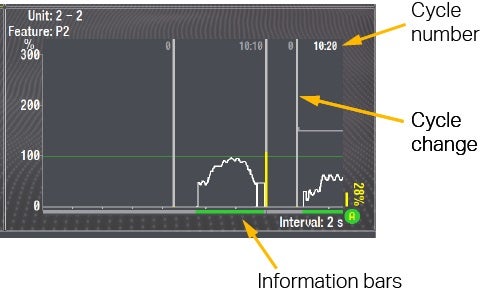
At the top left, the associated unit is indicated in the respective illustration. If you have not selected an individual designation, the number after the dot indicates the selected channel number in a multi-channel system.
Below is the name of the displayed feature.
The Y-axis on the left side specifies the size of the measuring range and the 100% mark (green line). Instead of percentages, PROVIS 3 can also display a different value here. You can configure another value in the software settings.
At the bottom is the scaling and the measuring range of the X-axis. The standard measuring range is Time.
In the top right corner, PROVIS 3 reports the operating states of the monitoring system by:
- "A": Activation of monitoring
- "T": Teach-In
- "S": Setup
- "R": Rework
Above the right boundary of a past cycle (white line), the cycle number, tool and cut are displayed in grey. The number of the currently active cycle is black. An individually assigned tool name is also possible.
Below the illustration, two informational bars move along. The informational bars make it possible to detect even afterwards, especially for service purposes, in which state the monitoring was at a specific point of time.
Upper and lower bar:
- Green: Monitoring active
- Grey: Monitoring not active
Upper bar only:
- Orange: Teach-In
- White: Rework
Lower bar only:
- White: Rapid feed
- Orange: Setup
Visualisation of limits
Dynamic limits
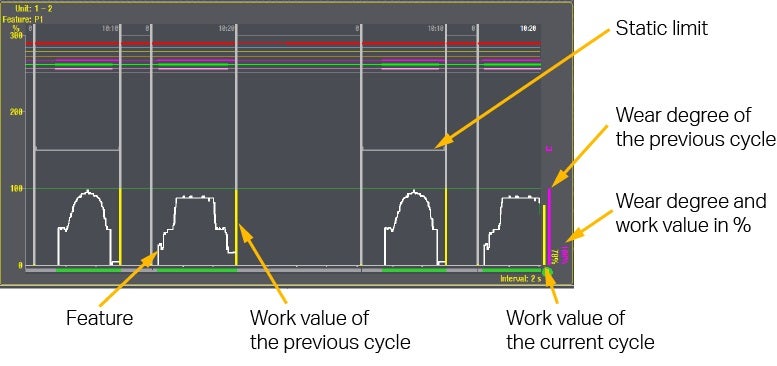
If dynamic limits for the current cycle are active, a yellow stripe appears on the sides of the signal curve.
Static limits
The grey lines indicate the position of the static limits; the ends of these lines indicate the type of the limit.
Work value limit
If a work value limit is switched on, the growing yellow bar to the right side displays the work value. The yellow text beside shows the corresponding value in percentage. For the past cycles, the work value is displayed as a vertical yellow line in the right boundary of the cycle.
Tool wear limit
If a tool wear limit is switched on, the growing dark magenta bar to the right side displays the wear degree of the previous cycle. The dark magenta text beside shows the corresponding value in percentage. The bar will turn orange if the tool is close to wear out.
CoroPlus® Process Control monitors your tools and analyses machining processes such as lathing, drilling, milling, grinding and dressing. The visualisation of the sensor or process signals sets the prerequisite for optimizing the machining processes.
With the CoroPlus® Process Control operating and visualisation software, PROVIS 3, you can operate the monitoring system.
Working with PROVIS 3
PROVIS 3 home screen is divided into three areas:
- Visualisation area
- Menu path area
- Function button area
The visualisation area at the top displays the features and limits of the respective station(s). Display and selection fields for unit settings, the operating states of the monitoring system (Teach-In, Rework, Setup), alarms, etc., are also displayed here.
The function button area is at the bottom. Depending on the context, the layout may change within a screen.
The name of the current menu and its path is always displayed above the function buttons in the menu path area.
In most menus, the visualisation area is divided into two sections:
- Feature representation is located on the left along with explanatory text in many menus
- Respective setting options and/or information text is on the right
You can change the settings for the monitoring system in the selection fields of PROVIS 3.
A field with a highlighted background is currently active, which means, that you can adjust this setting.
A field that does not have a background is inactive. They indicate that it is not possible to change this setting.
How do I select a different display?
The Home screen can display several features. The active feature is displayed with a thin yellow frame and yellow text. You can use the cursor buttons on the control system to switch to another feature.
How do I change to a different entry field?
You can use the up and down cursor buttons on the control system to change to other entry fields.
How do I make entries?
#
$
The function buttons and are shown for selected and active entry fields. You can recognize the selected field by the yellow descriptive text.
Use these function buttons to change the value in this selected entry field. The display switches to the next possible value by pressing the function buttons.
Furthermore, you can set configurable number values directly using number keys.
Less frequent used entry fields are hidden under a collective header. Below the header, the text "Details" or "Show all" is displayed next to a plus sign [+]. In this case, the function button [+] is displayed in the function button area.
Pressing this function button opens the hidden entry fields. You can select the displayed entry fields like all other entry fields and change the values. If the function button [-] is shown and pressed, this menu can be closed again.
How do I find an entry in a selection field quickly?
You can display a list of entries in the selection field using quick selection.
1.Select the desired setting with the mouse or cursor buttons.
2.Press the right cursor button.
3.Start entering characters until the desired setting appears.
4.Select the desired setting.
5.Confirm it with Enter or Input.
How do I change from the left to the right side of the visualisation area and vice versa?
You can use the right and left cursor buttons on the control system to do so intuitively. The area you are currently in is displayed in yellow.
How do I scroll through longer explanatory text?
Use the buttons Page Up and Page Down of the control system to scroll through longer texts.
Displays in the visualisation
After switching on the monitor and establishing communication with the connected units, you see the base menu on the monitor of PROVIS 3.
In the visualisation area, the monitor displays the following:
If applicable, several feature representations are displayed. A yellow arrow appears if not all features fit within the visualisation. This arrow at the edge of the visualisation area indicates that you can called up more in this direction. You can switch to these feature representations with the arrow keys of the control system. A feature representation is usually selected (highlighted in white).
At the top left, the associated unit is indicated in the respective illustration. If you have not selected an individual designation, the number after the dot indicates the selected channel number in a multi-channel system.
Below is the name of the displayed feature.
The Y-axis on the left side specifies the size of the measuring range and the 100% mark (green line). Instead of percentages, PROVIS 3 can also display a different value here. You can configure another value in the software settings.
At the bottom is the scaling and the measuring range of the X-axis. The standard measuring range is Time.
In the top right corner, PROVIS 3 reports the operating states of the monitoring system by:
- "A": Activation of monitoring
- "T": Teach-In
- "S": Setup
- "R": Rework
Above the right boundary of a past cycle (white line), the cycle number, tool and cut are displayed in grey. The number of the currently active cycle is black. An individually assigned tool name is also possible.
Below the illustration, two informational bars move along. The informational bars make it possible to detect even afterwards, especially for service purposes, in which state the monitoring was at a specific point of time.
Upper and lower bar:
- Green: Monitoring active
- Grey: Monitoring not active
Upper bar only:
- Orange: Teach-In
- White: Rework
Lower bar only:
- White: Rapid feed
- Orange: Setup
Visualisation of limits
Dynamic limits
If dynamic limits for the current cycle are active, a yellow stripe appears on the sides of the signal curve.
Static limits
The grey lines indicate the position of the static limits; the ends of these lines indicate the type of the limit.
Work value limit
If a work value limit is switched on, the growing yellow bar to the right side displays the work value. The yellow text beside shows the corresponding value in percentage. For the past cycles, the work value is displayed as a vertical yellow line in the right boundary of the cycle.
Tool wear limit
If a tool wear limit is switched on, the growing dark magenta bar to the right side displays the wear degree of the previous cycle. The dark magenta text beside shows the corresponding value in percentage. The bar will turn orange if the tool is close to wear out.
