
Frequently Asked Questions
A Plug icon shows up in my Dashboard or Operator Panel
Why does it appear?
The plug icon appears when there is a disconnection in the CoroPlus® Machining Insights data pipeline from the aggregator PC collecting data to the browser where CoroPlus® Machining Insights dashboards and operator panels are being shown.
This can happen if
- The MTConnect agent service is not running.
- The Collector service is not running.
- The Collector cannot communicate with the Sandvik Coromant server (ingest.machininginsights.sandvikcoromant.com)
- The browser showing CoroPlus® Machining Insights dashboards or operator panels is not connected to the internet.
NOTE:
Sometimes, when the PC is coming out of sleep, the disconnected icon can show up due to how the PC and the browser manage Internet connections while in sleep mode.
How can I fix this?
- Ensure that the agent and collector services are up and running on the aggregator PC. Since "Windows Updates" can automatically restart the PC, ensure that they take place in a scheduled update timeframe so that the Sandvik Coromant connection is not disrupted.
- Ensure that the aggregator PC can communicate with ingest.machininginsights.sandvikcoromant.com (Sandvik Coromant server).
Open Command Prompt and type: telnet ingest.machininginsights.sandvikcoromant.com 443
Expected response to telnet: It should open a blank screen and not show any errors - Ensure that the browser displaying CoroPlus® Machining Insights Dashboards or Operator Panels is connected to the internet.
Once the connection issue is fixed, CoroPlus® Machining Insights will stop showing the disconnected icon and start showing data. This can take up to 150 seconds. However, if the page is refreshed, CoroPlus® Machining Insights will show data immediately.
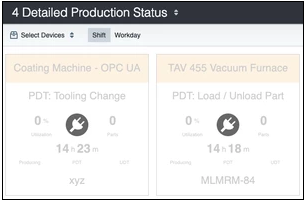
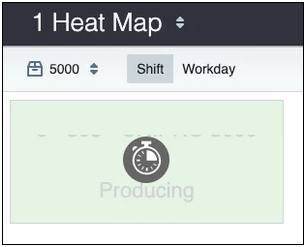
A Timer icon shows up in my Dashboard or Operator Panel
Why does it appear?
When the device has a clock skew, the timer icon appears on CoroPlus® Machining Insights dashboards and operator panels. Clock skew is when the time on an aggregator PC is not synced to an NTP server and differs from it by lagging behind or being ahead.
To know more about how windows handle time sync, please read the Microsoft online help article How the Windows Time Service Works.
How can I fix this?
- Sync the time on the aggregator PC to an NTP server
- Once the time is synced, CoroPlus® Machining Insights will stop showing the timer icon and start showing data. This can take up to 150 seconds. If the page is refreshed, CoroPlus® Machining Insights will show data immediately.
Please read the on how to synchronize Windows PC time with an NTP server.
Note:
This third-party article is not maintained or supported by Sandvik Coromant. Please get in touch with the third-party provider for all related support requests.
The text “Data Unavailable” shows up in my Dashboard or Operator Panel
Why does it appear?
The text "Data Unavailable" appears on CoroPlus® Machining Insights dashboards and operator panels when avail = UNAVAILABLE for a device in the MTConnect agent.
- When avail = UNAVAILABLE, the CoroPlus® Machining Insights clock will stop and no cycles will be recorded and shown in the Machining Insights app.
- Once avail = AVAILABLE, CoroPlus® Machining Insights will either show cycles from the data collected in the agent buffer or will show the disconnection period as "Data Unavailable".
This can happen if
- The shop floor device is not connected to the network.
- The adapter is not running.
- The adapter cannot communicate with the device.
- MTConnect agent is not running.
- MTConnect agent cannot communicate with the device.
How can I fix this?
- Ensure that the device is not switched off and can communicate over the network by pinging its IP address.
- Ensure that the adapter and the agent services are up and running on the aggregator PC.
